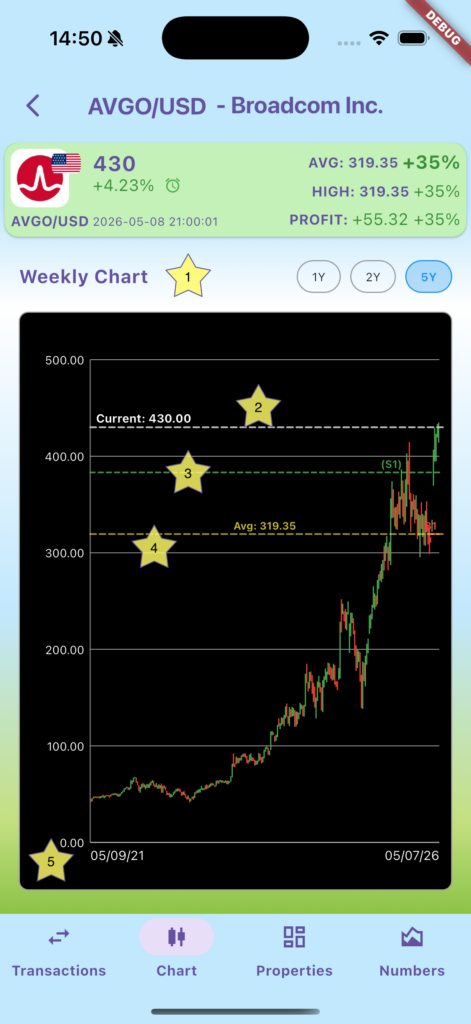

This tab gives you a quick weekly overview of the price action either over the last 5 years, 2 years or 1 year (1).
It shows the current price (2), and the price you have set a take profit alert (3). Buy alerts are labelled with B1, B2, B3 etc, sell alerts with S1, S2, S3 etc. As you can see I have not sold the asset yet despite the alert. (4) shows your average price. The axes (5) should be self-explanatory, but y-axis is the price, and the x-axis shows the date range.